Recently, you may have seen news reports paying considerable attention to the ‘yield curve inversion’. This metric was widely reported in the financial press as an inverted yield curve is considered by some economists to be a strong indicator of a forthcoming US recession.
For example, according to the economist Campbell Harvey, an inversion of the curve has accurately forecast the last seven US recessions. In finance, where foreshadowing signals can be influential, but ultimately ambiguous, this trend is noteworthy.

By Matthew Dow
Introduction
But, what does the jargon of an inverted yield curve actually mean? What is meant by yield? What specific yield is being referred to? Why do some treat this change in a curve as a soothsaying statistic? Finally, how does this changing curve impact the legal sector?
Bonds
The first thing to consider is that the yield curve inversion relates to the bond market. In particular, the market for US government bonds, colloquially known as treasury bonds, T-bonds or US treasuries.
The Investopedia definition of a bond is a ‘fixed income instrument that represents a loan made by an investor to a borrower”. Investopedia enriches this definition by portraying a bond as an IOU between the lender and a borrower.
More often the borrower, known as an ‘issuer’, will be a large corporation or a government that desires capital for its investments and its daily expenditure. After all, governments have costs for providing healthcare, education, infrastructure, national defence etc that are rarely covered by tax income alone. The issuer will create their IOUs to provide this funding.
In return, investors will hope to receive the IOU value/principal of the bond back, plus some interest. For investor clarity, each of these bonds or IOUs includes the key details of the agreement and any future payments.
The Key Details of Bonds
The important details to pay attention to in any bond are:
The price of the bond.
The par value of the bond.
This is the amount of money that bond issuers promise to repay investors at the bond’s end date. This amount does not change in most circumstances and is typically $100 or $1000.
The rating of the bond by ratings agencies – an indicator of the risk of non-payment.
The end date when the principal (IOU) is to be paid to the lender/bond owner, known as the bond’s ‘maturity’ date.
The terms for interest payments made by the borrower at regular intervals, often referred to as the bond’s ‘coupon’ payment.
NB. These coupon payments are fixed payments of a set value, say $10 or $50. They are not an % interest as would be the case with your savings account. The payments do not change as the market value of the bond changes.
This fixed income aspect is important because as the bond’s price changes, the bond’s coupon payments stay consistent. However, the de facto rate of interest that investors receive from the bond changes as a result.
Fixed Income and Investor Demand
It is important to realise with any bond, the coupon payments that you receive are fixed in advance. Further, the ‘par value’, or the payment that you obtain upon the bond’s maturity date (the end date of the bond), is predetermined. This information will be explicitly expressed to investors from day 1.
The exception to this certainty arises when the bond issuer defaults on their agreed payments. As a result, to encourage investors, the bonds with a higher risk of default will typically have higher ‘interest’ payments, than say a perceived less risky bond like a US government bond.
Following a short-prescribed period after being issued, the bond becomes a tradeable asset. This means that the bond can be sold between investors on the secondary market. Therefore, the market price of the bond may change over time depending on the levels of supply and the investor demand.
Varying Investor Demand
The investor demand for bonds varies for multiple reasons. A feature of the demand is the notion that bonds, especially from the US government, are typically seen as safer assets, than say equities.
Bonds are perceived as being able to better retain their value in tougher economic times. This is because bondholders are paid out before shareholders in the event of any company’s insolvency.
Additionally, the most secure investment is considered to be US government bonds. The reason being that governments can almost always borrow money if required. Further, the US government has historically honoured its financial commitments to its bondholders. In contrast, shares, commodities, funds and real estate assets can all plummet in value during a recession.
Consequently, when investors are looking for security, rather than capital growth, such as during recessions – they tend to reallocate more of their investment portfolio to government bonds.
Terminology
Terminology wise, the bonds that are issued by governments are called sovereign bonds. Furthermore, in financial jargon, most US government bonds with maturities of a year or less are known as ‘bills’, rather than ‘bonds’. Those with 2 year to 10-year maturity dates are called treasury ‘notes’. Longer term bonds with maturities of over 10 to 30 years keep the name ‘bonds’. However, ‘bond’ or ‘fixed income’ nomenclature is widely used for all of these assets.
In terms of the recent ‘yield curve inversion’, investors are comparing the yields/rates of two closely watched bonds that mature on 2 distinct dates. The bonds that are compared are the 2 year and 10-year treasury notes.
Sovereign Bond Example – Higher Interest Rates for Longer Term Investment
Let us imagine then that we wanted to lend $1000 to the US government for 2 years.
Rather than slip our deposit into Trump’s wallet, the US government creates an IOU for 2 years. This IOU is better known as a 2-year treasury note. We would purchase this 2-year note directly off the US government on the primary market at an auction, or buy it from somebody else on the secondary market.
Now, if we left $1000 in our savings account at the bank, we know that we would get an interest payment of a few percent. Therefore, to compensate us from losing out, we would also demand to be paid interest for our IOU by the US government.
This interest payment is necessary because unless we sell our bond, we will not have any access to our money until it is repaid in two years’ time. Therefore potentially, losing out on some great investment opportunities during this period.
In addition, we know that could invest our money elsewhere for a much higher rate of interest in a corporate bond. However, we cannot be certain that we will be paid back in 2 years’ time.
Instead, feeling pretty confident that the US government will not run off into the sunset in 2 years, we settle for a lower rate of return on our investment – say 1.5% return each year. As bondholders, we receive our ‘interest’ payment in the form of a fixed-sum ‘coupon’ payment every six months. This payment will be around $15 a year, each year.
But, what if we wanted to lend to the US government for longer, say 10 years instead of 2 years?
Well, the alteration of that date, fundamentally changes our investment outlook. The interest rate that we would demand is probably higher than the yearly 1.5% that we get for the 2-year treasury note.
This higher rate is to do with the risk and the return of our bond investment. After all, if I tie my money up for 10 years and higher returning, non-risky investments emerge, I will lose out.
Opportunity Cost
For example, say the economy starts booming and businesses everywhere want new loans. The bank is happy to oblige these loans, but it has limited money to lend. Therefore, to meet its additional loaning needs, the bank has to attract more depositors. To do this, the bank offers a competitive interest rate.
If the bank offers to pay 3% interest on my savings account, whilst I am stuck being invested in a bond paying a coupon rate of only 1.5% – I could be losing 1.5% extra interest on that $1000 of mine every year for 10 years. Also, bank savings are relatively low risk of being suddenly lost. Therefore, the security benefit of the bond investment is negligible.
At least, with the 2-year bond, I get my $1000 par value/principal back after 2 years. I can then put this money in the bank for the 8 remaining years and acquire the improved bank interest rate.
Additionally, I can be reasonably assured that I will be paid the principal back by the bond issuer in 2 years. However, over 10 years anything can happen – the risk of the bond issuer’s default is much higher. For me, there is 8 years’ worth of additional risk in holding the 10-year bond.
Therefore, typically, I want a more generous interest rate from a 10-year note, compared to the 2-year note. Otherwise, assuming prices do not change, I will just buy the 2-year note, 5 consecutive times – mitigating my exposure. This example is indicative of a broader trend. In general, the longer the date until maturity, the greater the yield/rate of return that investors will demand.
Yield
What we are discussing above is the yield that we expect to receive.
The current yield is the coupon rate earned on our bond, divided by the current market price of our bond.
Therefore, if our 2-year bond (with a par value upon maturity of $1000) has a coupon payment of $15 each year, it can be said to have a coupon rate of 1.5%. If the bond sells for the market price of $1000, then the current yield is 1.5%.
However, if the bond sells on the market for only $500, then its current yield is 3% (15/500). If the bond’s price rises to $1500, then the current yield of the bond lowers to 1.0% (15/1500).
In short, as the bond’s price rises – yields go down. The higher the yields the better the return for investors. In addition, the higher the cost of borrowing for governments.
So far, we have assumed that our 2 year, 10 year and even 30 year bonds cost $1000. Furthermore, we believe that they all pay back the $1000 principal/IOU upon their respective maturity + some fixed interest as a coupon payment throughout the lifetime of the bond.
However, the market value of the bond rarely matches the amount to be received upon maturity. In fact, it tends to only closely resemble the final amount to be repaid upon maturity as you reach the maturity date. This is logical. No investor will pay $1500 for a bond that they know will only be worth $1000 tomorrow at the bond’s maturity date.
In fact, on the secondary market, bonds can be traded daily and the bond’s market price reflects investors’ concerns and expectations.
For instance, investors may be worried about the issuer’s risk of default and price this in. As evidence, investors factored this default risk into the Greek government’s bond prices from 2008 onwards. Investors feared that they would not be paid back in full, therefore they continuously sold these bonds, reducing the bond’s price and raising its yield.
Furthermore, the prices of bonds also vary due to inflation fears, the time value of money and the relative bond value. For example, higher returns may be available elsewhere for similar risk levels.
Arbitrage
In addition, bond prices may drop due to arbitrage, (circumstances where the same asset has differing prices).For instance, say for the last 12 months, you have possessed, a 2-year US government bond paying a fixed coupon, equivalent to an interest rate of 2%. Therefore, in this example, there is now only 1 year left until the bond reaches maturity.
If a new 1 year maturing bond is issued by the US government paying a coupon rate equivalent to 3% yield, then the price of your bond will decline to match this new yield. Your 2% fixed payment will have to mirror the 3% yield now on offer elsewhere.
The only way to do this with a fixed interest payment, is by reducing the bond’s market price. The alternative, is that there will be no demand for your bond at all on the secondary market, as there is an exact duplicate treasury note on the market paying 1% more a year.
Prices and Yield
As the market value of the bond drops, the coupon payments received by the investor still remain fixed. So, anyone purchasing the bond once the price has dropped will be getting a higher return. Therefore, the yield of the bond actually increases as the price falls.
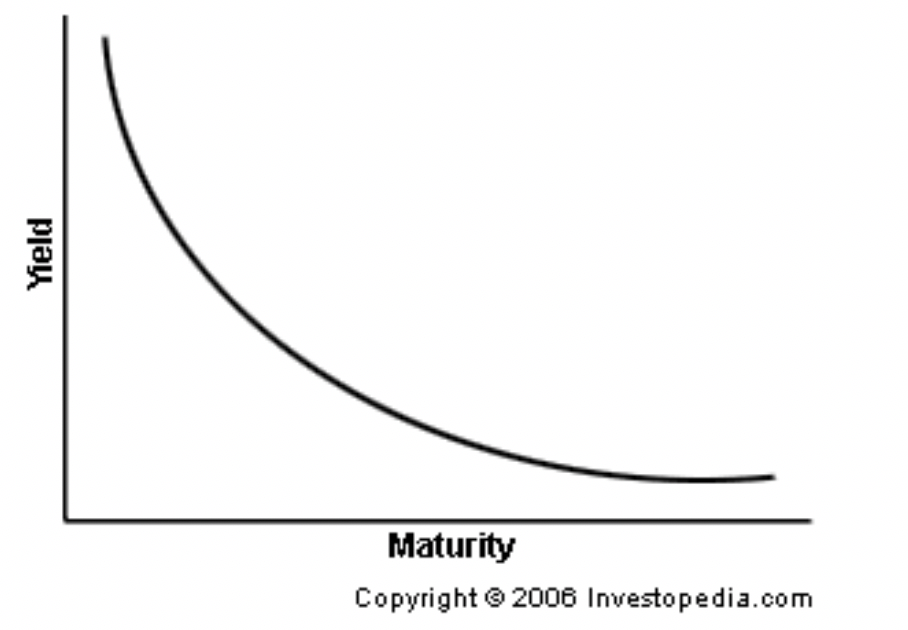
We can plot the yields of US government bonds that mature at different dates on a graph. The y axis features the % ‘yield to maturity’ of the bond. The ‘yield to maturity’ is the yield the investor would get if they held the bond until maturity. In contrast, the current yield is the yield at the present moment. For instruction purposes, we will stick with the idea of current yield.
The x axis presents the bond’s maturity date, usually ranging from a few months to over 30 years. This graph is known as the yield curve.
If we plotted the yields of bonds at different maturities we should see a curve emerge. Usually, the yield curve will slope upwards. This normal yield curve occurs as investors demand higher yields for longer term investments, eg a few % points higher interest rate return for 30 year bonds, than 3 month bonds.
Inverted Yield Curve
However, as demand rises for longer term bonds, the prices of longer term bonds will increase. Imagine our 10-year bond going from a market price of $1000 to $1500, but still paying $15 a year as a coupon. As a result, the respective yield of longer term bonds will change.
The coupon payments (remaining the same as before the demand increase), will now be divided by a larger market value of the bond (due to the price increase caused by the sudden demand). Consequently, these longer-term bonds’ yields will shrink.
This will change the slope of the graph. Yields for bonds at shorter maturities like 2-year bonds will be greater than the yields for longer maturing 10-year bonds. If this trend continues, this can lead to an inversion of the curve.
So, what happened with the recent inversion?
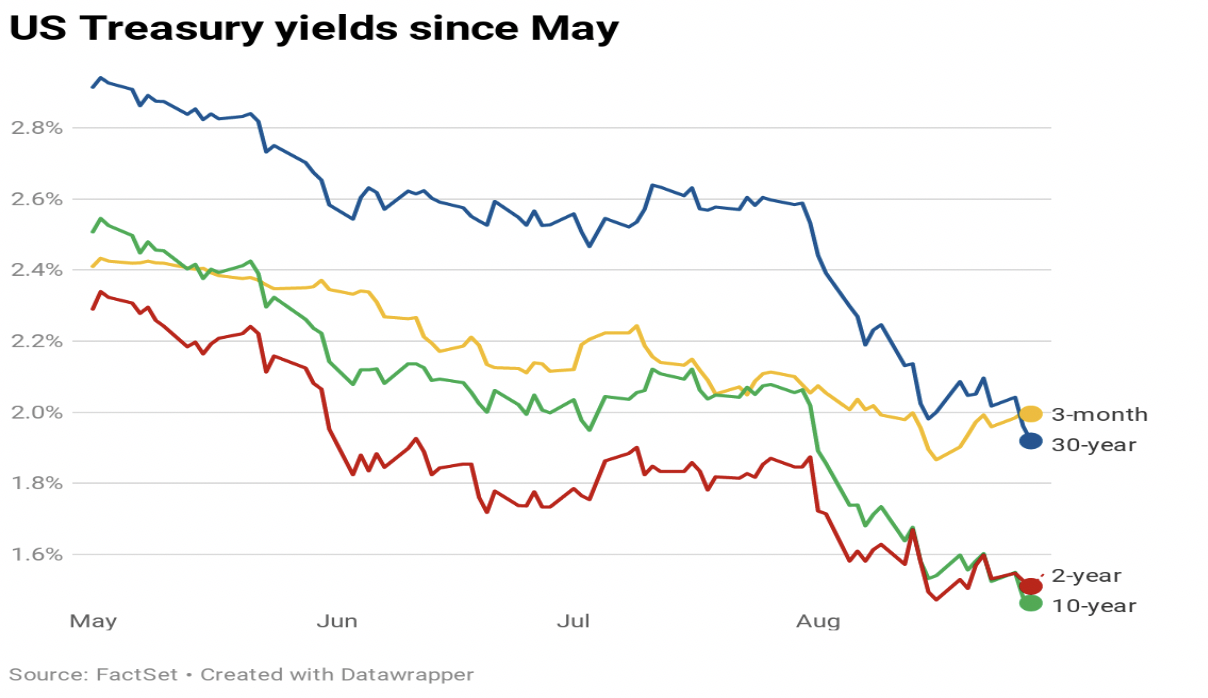
What we saw in August, was the slope of the yield curve change. Rising trade tensions between the US and China, negative/low yields in long term bonds in much of the Eurozone, combined with uncertainty over the federal reserve’s interest rate change meant that international demand for 10-year treasury note rose.
2-year treasury notes did not see the same level of demand increase. So, prices and therefore yields remained about the same there.
The result was that that the price of the 10-year treasury note rose. Consequently, the 10-year treasury note yield reduced. Indeed, the yield on 10-year treasury note reduced to 1.453%. – slightly below our hypothetical example.
The significance of this metric is that this meant that the 10-year bond was trading 4 basis points or 0.04% lower than the 2-year treasury note. This is completely contrary to typical expectations.
This means that investors were prepared to receive a lower rate of interest for their US bond for 10 years, than 2 years. The 2-year treasury bond yield point on the y axis, was higher than the 10-year treasury bond yield point. The yield curve after flattening for a long while now, briefly inverted.
What does this inversion mean? What explains it and recession ahead?
A yield curve inversion traditionally means that investors suspect that economic fortunes for the US in the short term will not be as favourable. This inversion often precedes a recession by 12-24 months.
The theory suggests that investors are predicting a low growth economy. Financiers contend that companies’ profits will not grow as fast in the future. Furthermore, businesses lacking confidence, will not invest as much as before. Moreover, employees may lose their jobs and have less income to spend, reducing economic growth elsewhere in other sectors.
Therefore, the return from shares or commodities may not be as strong for investors compared to the last few years. Hence, stockholders are prepared to switch to safer assets such as bonds, rather than equities.
In addition, interest rates play a huge role in causing the curve change. Interest rate increases are the tool of central banks to combat inflation during a growing economy. In contrast, central banks tend to artificially lower interest rates to encourage economic growth during recessions.
Government bond yields respond to these central bank inspired interest rates. This is because safe assets like government bonds are often benchmarked by what interest rates you can receive from central banks. A low interest rate lowers the return on government bonds.
This low return on these bonds is evident worldwide. Since the financial crisis of 2008, government bond yields have been incredibly low – in some places such as Germany bond yields are even negative. In Japan, negative rates have been the norm for decades. This means that you actually receive less money than the amount you originally gave in your government IOUs.
Consequently, fearing recession and uncertain of the future rate changes, investors anticipate that future US bond yields could also experience this yield reduction.
Therefore, investors are prepared to pay for the privilege of having a reasonable yield secured for 10 years. The expected declining economic situation leads them to believe that next year’s yields will ultimately be lower than those currently available.
After all, why would you secure a positive yield for only 2 years, if you genuinely believed in 2 years’ time that the yield would be significantly lower?
Well, regulation also factors in here.
A lot of demand for sovereign bonds comes from institutional investors. These institutional investors often legally have to hold a certain amount of ‘safe’ reserves that they can quickly sell. This checklist includes cash, bonds and central bank deposits.
These ‘safe’ government bonds are primarily used by these investors for liquidity (easy to sell) purposes as they are tradeable assets. In contrast, real estate assets take months to sell.
Therefore, if you expected yields to reduce or even become negative in the future due to a possible recession. Furthermore, knowing that other banks may charge you to hold idle cash too. The wise choice to fulfil your legal obligations may be to buy longer term bonds and get locked in to a positive return. Inverting the normal yield curve in the process.
What does this inversion mean for law firms?
Overall, the inverted yield curve is just one influential metric within the financial markets. It is unlikely that this inversion alone will cause a significant change to law firms’ business strategies.
For example, professional investors disagree as to the inversion’s value or meaning. After all, the yield curve has been flattening for a while due to the unique low interest, low growth monetary policy environment will now live in. Furthermore, there is a suggestion that the inversion was specific context driven, rather than an obvious sign of attitudes towards the US’s recession prospects.
Nonetheless, the metric has been a reliable indicator to many businesses before. Repeated coverage of it too may affect business’s confidence on certain investments.
For example, boards of directors may be more cautious about going ahead with certain larger ventures or cross-national expansion. Instead they may scale back, choose fewer jurisdictions to concentrate on, or delay their investment.
A more bearish outlook in the financial markets may eventually impact law firms directly too. This is apparent as a growing trend has seen law firms IPO to secure capital for needed personnel, technology investment and overseas office expansion. A market with less faith in the economy’s growth prospects may not be able to provide the desired finance to make such a strategy worthwhile.
Elsewhere, the suggestion of a recession within the next 24 months could impact corporate law firms’ key practice areas. Mergers with other companies may be delayed. Acquisitions in the US may be re-evaluated. This is particularly the case in sectors that are hit harder by recessions, such as construction and manufacturing.
Likewise, major infrastructure projects relying on project finance or asset finance may be reconsidered. For instance, companies in emerging markets may become more favourable for investments. This change in focus could lead to innovative international partnerships for firms in these sectors. Alternatively, it could lead to lawyers with better levels of knowledge about particular regions growing their teams.
A recession may strengthen the case for larger international firms with diverse practice areas, hundreds of lawyers and international exposure. Alternatively, it may lead to praise for the US firm model of lean management and concentration on high margin work.
Finally, a recession often correlates with increased levels of restructuring and litigation. This is because the benefits of the dispute are worth fighting for more. Thus, clients may negotiate the contractual details in the event of a dispute or insolvency with more vigour. Additionally, there may be more security demanded for certain projects.
Conclusion
Ultimately, the yield curve inversion is one financial statistic. There are many other statistics, such as employment trends, manufacturing data and share price highs, that depict opposite economic fortunes for the US.
Nonetheless, the yield curve inversion impact is discussed by the financial sector. Therefore, it is worth corporate lawyers considering its implications as well.
Matthew completed his undergraduate in History and Politics at Oxford in 2014. He has pivoted to law after spending the last few years working in mobile marketing for King. He obtained his LLB from the University of Law, Bloomsbury and now works as a paralegal for Kingsley Napley.